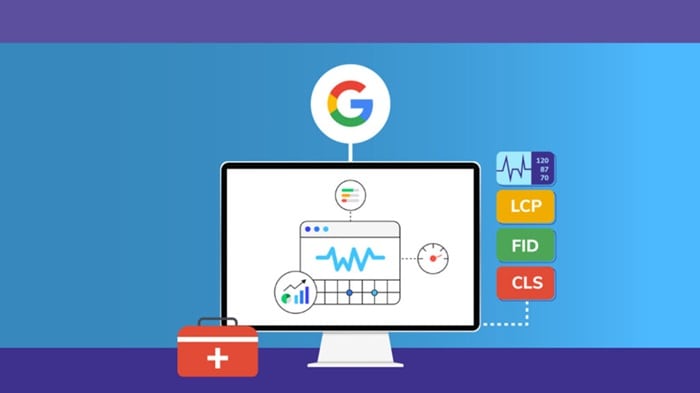
Google has released a video tutorial that focuses on identifying and fixing Interaction to Next Paint problems which occur on websites. That announcement came at a time when INP emerged to replace First Input Delay as a Core Web Vital; this indicates the serious shift in the approach taken by Google towards assessing user experience.

Assessing and Improving INP Performance
To this end, Google suggests testing your website for its present INP performance by using PageSpeed Insights and Chrome’s User Experience Report. This threshold of “good”-that is to say, the performance of 75% of page loads—is an aspired-to benchmark.
By finding and fixing issues such as long JavaScript tasks, excessive main thread work, or complex DOMs, developers can improve a website’s scores for INP.
You can also read: Google’s New Interaction to Next Paint (INP) to Replace First Input Delay on March 12
The video tutorial provides a step-by-step walkthrough on using Chrome DevTools to identify INP issues.
Here’s a detailed breakdown of the steps covered in the tutorial:
- Open Chrome DevTools: Begin by launching the Chrome DevTools panel in your browser. You can do this by right-clicking on the page and selecting “Inspect” or by using the keyboard shortcut Ctrl+Shift+I (Windows) or Cmd+Option+I (Mac).
- Simulate a slower mobile device: Within the DevTools panel, click the “Device Toggle” icon (depicted as a phone and tablet) to activate the mobile display emulation. Then, navigate to the “Network” tab and choose “Mid-tier mobile” from the throttling dropdown menu to replicate a slower mobile connection.
- Record user interactions: Open the “Performance” tab in DevTools and begin recording via the “Record” button-a solid black circle. Actually use the website: interact with the website as any user of that website would do, clicking buttons or links that do something on the page. Complete the interaction and stop recording with the “Stop” button-a solid red circle.
- Performance Analysis: Once recording is stopped, a performance graph will appear. Extend the “Interactions” track to reveal it. The track will show the time since you clicked until something changed on the screen. Line up the interaction with what was going on the “Main” thread to identify the long tasks causing slow interactions.
- Identify problematic code Using the Summary pane: There is a link to the page source. Click this link; it will directly take you to the code that is causing slow interaction. This will allow you to start investigating the problem.
Relevance for SEO Experts
Timing is everything with this tutorial, as INP has become a Core Web Vital; it’s going to affect SEO. In the video released for this tutorial, Google underscores how important adaptation is when it comes to this change in INP.
As the search engine continues its evolution of what it considers vital when measuring user experience, SEO specialists and developers can ensure success by being informed about the latest tools and best practices.
You can also read: Best Tools for Google’s Interaction to Next Paint (INP) Metric
In Conclusion
The latest video tutorial, which has appeared on Google’s page, answers all the questions of INP and is a great help for SEO specialists and web developers, as it allows them to take care of this transition and create optimized websites.
Take all the steps included in this tutorial and keep up with the latest news in order to maintain your website competitive and offer a great user experience.
Would you like to read more about “how to identify INP issues” related articles? If so, we invite you to take a look at our other tech topics before you leave!
Use our Internet marketing service to help you rank on the first page of SERP
![]()


