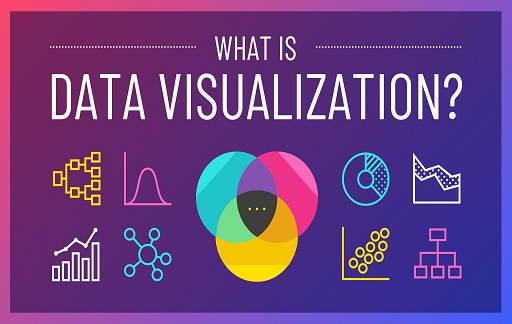
Importance of Data Visualization: The presenting of data in a graphical style is known as data visualization. It’s used to make numbers easier to read, track trends over time, and compare different data sets together to see how they relate to each other. Data visualization can be used in nearly every industry imaginable, from business analytics to healthcare and education. Still, it’s essential in infographics because it can help people better understand information by seeing it together rather than in individual pieces.

Data, Data Everywhere
Visualizing data from different angles and presenting it in different ways helps you explore your data more effectively. Even more critical, visualizations help others understand your data-driven findings and proposals—many popular tools for creating compelling data visualizations, including Excel Charts, Google Sheets, and Tableau. In addition to these traditional tools, there are also several free or cheap services online that can be used for simple tasks without installing software or learning how to code (examples include Prezi, Piktochart, and Easel.ly).
You may also like Data Science Courses & Training
The Importance of Data Analysis
Data analysis, also known as data science, can be a tremendous tool for businesses looking to gain insight from their data. Data visualization lets companies quickly make sense of massive amounts of information, giving them a better understanding of what’s going on and providing solutions that would otherwise be difficult to find. When it comes to growing your business, you want all the advantages you can get—and data analysis helps provide those advantages!
Over 90% Of Businesses Are Losing Money On Poor Data
Data visualization plays a significant role in today’s businesses. But how important is it? To understand how big data visualization impacts companies, it’s vital to break down its components. First, let’s look at data. According to Forbes, Data drives digital transformation initiatives that create competitive advantage and business growth.
The overwhelming majority (90%) of senior business leaders say they increase their investments in big data technologies such as Hadoop. Well-informed decision-making depends on timely access to reliable information; however, making sense of all those zeros and ones can be difficult without some help. Enter: data visualization tools—the most efficient way for people with little or no computer science background to quickly analyze large amounts of complex data.
How Do You Deal With Large Sets Of Data
Large data sets are standard in research, but dealing with them can be tricky. Most people don’t want to wade through a stack of excel files and printed tables to analyze trends, make comparisons, or identify patterns. A compelling data visualization helps you quickly process and understand large amounts of information. Once your data has been organized into a digestible graphic, it’s easier to know where you are spending your money (or not), which shows positive trends or red flags that require attention. The most crucial point to remember when working with large data sets is that your ultimate goal should be to get actionable insights from your data so you can take corrective measures if necessary and track performance over time.
You may also like Advantages of Partnering with a Microsoft Power BI Consulting Company
Visualize Your Results
With so much data, it’s difficult to grasp what you should focus on and what you should ignore. While raw data can be hard to interpret, a visual representation can make all of your numbers easy to consume. Many decision-makers prefer visualization to raw data. So before sending your report, chart or graph it and send that instead. It could mean the difference between a Nice job! or a That isn’t exactly what I had in mind.
Why Data Visualization Is So Essential In Today’s Digital World
It can be hard to keep up with all of the information being thrown at us daily in today’s world. With so much data coming at us, it’s easy to get lost in it all and not know how to decipher what is relevant and what isn’t. This means that people become buried in data, and they miss out on important information that could impact their lives. If we can take a large amount of data and translate it into a visual piece, we can help those who want to understand find patterns that would otherwise go unnoticed. Data visualization helps people put numbers into context to understand them better.
You may also like New Ransomware Targeting Unpatched Microsoft Exchange Servers
Conclusion
Our society is increasingly dependent on data for everyday functions, such as financial and business decisions. Our lives also become more dependent on technology every day. Therefore, it’s essential to ensure that we have ways to collect, analyze and use data in a way that assists us in creating better decisions and living healthier lives.
Furthermore, there are many applications for data visualization outside of pure statistics; other disciplines like architecture and engineering have recently begun applying design elements from information design to their fields. While no single way of presenting information can be considered best, new technologies are constantly emerging to improve efficiency in creating data visualizations.
Would you like to read more about the Importance of Data Visualization-related articles? If so, we invite you to take a look at our other tech topics before you leave!
![]()


